.Net Core服务监控报警指标上报Prometheus+Grafana
前言
简单集成Prometheus+Grafana,指标的上报收集可视化。
Prometheus
Prometheus是一个监控平台,监控从HTTP端口收集受监控目标的指标。在微服务的架构里Prometheus多维度的数据收集是非常强大的 我们首先下载安装Prometheus和node_exporter,node_exporter用于监控CPU、内存、磁盘、I/O等信息
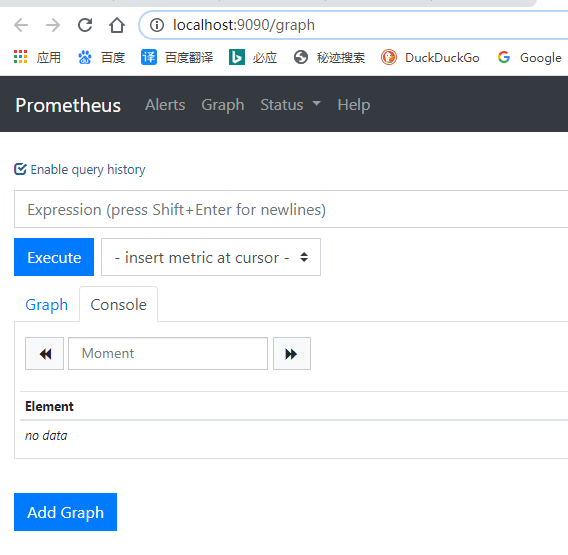
下载完成后解压以管理员运行 prometheus.exe 访问 http://localhost:9090/ 出现一下页面说明启动成功啦
.Net Core获取指标
有了Prometheus,我们还需要给Prometheus提供获取监控数据的接口,我们新建一个WebApi项目,并导入prometheus-net.AspNetCore包,在Configure中加入UseMetricServer中间件
public void Configure(IApplicationBuilder app, IWebHostEnvironment env)
{

    app.UseMetricServer();

}
启动项目访问http://localhost:5000/metrics就可以看基本的一些监控信息啦,包括线程数,句柄数,3个GC的回收计数等信息。
# HELP process_num_threads Total number of threads
# TYPE process_num_threads gauge
process_num_threads 29
# HELP process_working_set_bytes Process working set
# TYPE process_working_set_bytes gauge
process_working_set_bytes 44441600
# HELP process_private_memory_bytes Process private memory size
# TYPE process_private_memory_bytes gauge
process_private_memory_bytes 69660672
# HELP dotnet_total_memory_bytes Total known allocated memory
# TYPE dotnet_total_memory_bytes gauge
dotnet_total_memory_bytes 2464584
# HELP dotnet_collection_count_total GC collection count
# TYPE dotnet_collection_count_total counter
dotnet_collection_count_total{generation="1"} 0
dotnet_collection_count_total{generation="0"} 0
dotnet_collection_count_total{generation="2"} 0
# HELP process_start_time_seconds Start time of the process since unix epoch in seconds.
# TYPE process_start_time_seconds gauge
process_start_time_seconds 1592448124.2853072
# HELP process_open_handles Number of open handles
# TYPE process_open_handles gauge
process_open_handles 413
# HELP process_virtual_memory_bytes Virtual memory size in bytes.
# TYPE process_virtual_memory_bytes gauge
process_virtual_memory_bytes 2225187631104
# HELP process_cpu_seconds_total Total user and system CPU time spent in seconds.
# TYPE process_cpu_seconds_total counter
process_cpu_seconds_total 1.171875
Help 是收集指标的说明,Type收集指标的类型
但是作为HTTP应用怎么能没有HTTP的监控和计数呢,只需要加加入UseHttpMetrics中间件就可以对HTTP请求监控和计数,主要注意的是UseHttpMetrics最好放在UseEndpoints和UseRouting中间
public void Configure(IApplicationBuilder app, IWebHostEnvironment env)
{
    app.UseMetricServer();

    app.UseRouting();

    app.UseHttpMetrics();

    app.UseEndpoints(endpoints => { endpoints.MapControllers(); });
}
启动项目继续访问http://localhost:5000/metrics
# HELP http_requests_in_progress The number of requests currently in progress in the ASP.NET Core pipeline. One series without controller/action label values counts all in-progress requests, with separate series existing for each controller-action pair.
# TYPE http_requests_in_progress gauge
可以看到已经有了,我们随便请求一下服务看看效果,会帮我们记录下总耗时,总请求数,和每次请求的耗时数
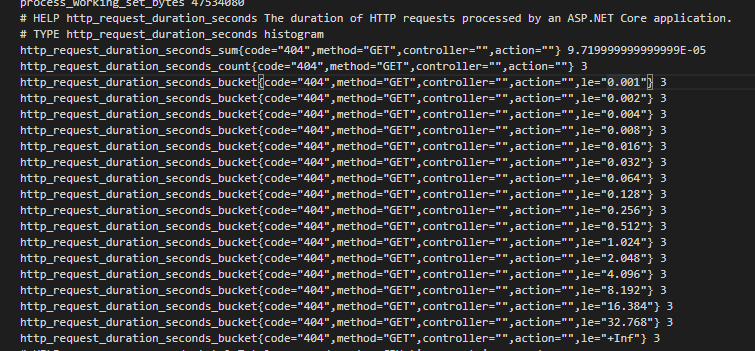
但是单单有上面那些数据好像还不太好定位一下很奇葩的问题,这时候我们可以获取Runtime的一些数据,方法童谣很简单。导入prometheus-net.DotNetRuntime 包,它可以帮助我们看到如下指标
- 垃圾回收的收集频率和时间
- 服务占用堆大小
- 对象堆分配的字节
- JIT编译和JIT CPU消耗率
- 线程池大小,调度延迟以及增长/缩小的原因
- 锁争用情况
我们只需要在Program的Main方法中启动收集器就可以啦。
public static void Main(string[] args)
{
    DotNetRuntimeStatsBuilder.Default().StartCollecting();
    CreateHostBuilder(args).Build().Run();
}
启动项目继续访问http://localhost:5000/metrics测试一下
# HELP dotnet_collection_count_total GC collection count
# TYPE dotnet_collection_count_total counter
dotnet_collection_count_total{generation="1"} 0
dotnet_collection_count_total{generation="0"} 0
dotnet_collection_count_total{generation="2"} 0
# HELP process_private_memory_bytes Process private memory size
# TYPE process_private_memory_bytes gauge
process_private_memory_bytes 75141120
# HELP dotnet_gc_pause_ratio The percentage of time the process spent paused for garbage collection
# TYPE dotnet_gc_pause_ratio gauge
dotnet_gc_pause_ratio 0
# HELP http_requests_received_total Provides the count of HTTP requests that have been processed by the ASP.NET Core pipeline.
# TYPE http_requests_received_total counter
# HELP dotnet_gc_collection_seconds The amount of time spent running garbage collections
# TYPE dotnet_gc_collection_seconds histogram
dotnet_gc_collection_seconds_sum 0
dotnet_gc_collection_seconds_count 0
dotnet_gc_collection_seconds_bucket{le="0.001"} 0
dotnet_gc_collection_seconds_bucket{le="0.01"} 0
dotnet_gc_collection_seconds_bucket{le="0.05"} 0
dotnet_gc_collection_seconds_bucket{le="0.1"} 0
dotnet_gc_collection_seconds_bucket{le="0.5"} 0
dotnet_gc_collection_seconds_bucket{le="1"} 0
dotnet_gc_collection_seconds_bucket{le="10"} 0
dotnet_gc_collection_seconds_bucket{le="+Inf"} 0
# HELP dotnet_total_memory_bytes Total known allocated memory
# TYPE dotnet_total_memory_bytes gauge
dotnet_total_memory_bytes 4925936
# HELP dotnet_threadpool_num_threads The number of active threads in the thread pool
# TYPE dotnet_threadpool_num_threads gauge
dotnet_threadpool_num_threads 0
# HELP dotnet_threadpool_scheduling_delay_seconds A breakdown of the latency experienced between an item being scheduled for execution on the thread pool and it starting execution.
# TYPE dotnet_threadpool_scheduling_delay_seconds histogram
dotnet_threadpool_scheduling_delay_seconds_sum 0.015556
dotnet_threadpool_scheduling_delay_seconds_count 10
dotnet_threadpool_scheduling_delay_seconds_bucket{le="0.001"} 0
dotnet_threadpool_scheduling_delay_seconds_bucket{le="0.01"} 10
dotnet_threadpool_scheduling_delay_seconds_bucket{le="0.05"} 10
dotnet_threadpool_scheduling_delay_seconds_bucket{le="0.1"} 10
dotnet_threadpool_scheduling_delay_seconds_bucket{le="0.5"} 10
dotnet_threadpool_scheduling_delay_seconds_bucket{le="1"} 10
dotnet_threadpool_scheduling_delay_seconds_bucket{le="10"} 10
dotnet_threadpool_scheduling_delay_seconds_bucket{le="+Inf"} 10
# HELP process_working_set_bytes Process working set
# TYPE process_working_set_bytes gauge
process_working_set_bytes 50892800
# HELP process_num_threads Total number of threads
# TYPE process_num_threads gauge
process_num_threads 32
# HELP dotnet_jit_method_seconds_total Total number of seconds spent in the JIT compiler
# TYPE dotnet_jit_method_seconds_total counter
dotnet_jit_method_seconds_total 0
dotnet_jit_method_seconds_total{dynamic="false"} 0.44558800000000004
dotnet_jit_method_seconds_total{dynamic="true"} 0.004122000000000001
# HELP dotnet_gc_pinned_objects The number of pinned objects
# TYPE dotnet_gc_pinned_objects gauge
dotnet_gc_pinned_objects 0
# HELP process_start_time_seconds Start time of the process since unix epoch in seconds.
# TYPE process_start_time_seconds gauge
process_start_time_seconds 1592449942.6063592
# HELP dotnet_gc_heap_size_bytes The current size of all heaps (only updated after a garbage collection)
# TYPE dotnet_gc_heap_size_bytes gauge
# HELP http_request_duration_seconds The duration of HTTP requests processed by an ASP.NET Core application.
# TYPE http_request_duration_seconds histogram
# HELP dotnet_contention_seconds_total The total amount of time spent contending locks
# TYPE dotnet_contention_seconds_total counter
dotnet_contention_seconds_total 0
# HELP dotnet_gc_pause_seconds The amount of time execution was paused for garbage collection
# TYPE dotnet_gc_pause_seconds histogram
dotnet_gc_pause_seconds_sum 0
dotnet_gc_pause_seconds_count 0
dotnet_gc_pause_seconds_bucket{le="0.001"} 0
dotnet_gc_pause_seconds_bucket{le="0.01"} 0
dotnet_gc_pause_seconds_bucket{le="0.05"} 0
dotnet_gc_pause_seconds_bucket{le="0.1"} 0
dotnet_gc_pause_seconds_bucket{le="0.5"} 0
dotnet_gc_pause_seconds_bucket{le="1"} 0
dotnet_gc_pause_seconds_bucket{le="10"} 0
dotnet_gc_pause_seconds_bucket{le="+Inf"} 0
# HELP process_virtual_memory_bytes Virtual memory size in bytes.
# TYPE process_virtual_memory_bytes gauge
process_virtual_memory_bytes 2225201872896
# HELP dotnet_gc_finalization_queue_length The number of objects waiting to be finalized
# TYPE dotnet_gc_finalization_queue_length gauge
dotnet_gc_finalization_queue_length 0
# HELP dotnet_threadpool_io_num_threads The number of active threads in the IO thread pool
# TYPE dotnet_threadpool_io_num_threads gauge
dotnet_threadpool_io_num_threads 3
# HELP process_open_handles Number of open handles
# TYPE process_open_handles gauge
process_open_handles 436
# HELP dotnet_gc_collection_reasons_total A tally of all the reasons that lead to garbage collections being run
# TYPE dotnet_gc_collection_reasons_total counter
# HELP process_cpu_seconds_total Total user and system CPU time spent in seconds.
# TYPE process_cpu_seconds_total counter
process_cpu_seconds_total 0.890625
# HELP http_requests_in_progress The number of requests currently in progress in the ASP.NET Core pipeline. One series without controller/action label values counts all in-progress requests, with separate series existing for each controller-action pair.
# TYPE http_requests_in_progress gauge
# HELP dotnet_threadpool_adjustments_total The total number of changes made to the size of the thread pool, labeled by the reason for change
# TYPE dotnet_threadpool_adjustments_total counter
# HELP dotnet_jit_cpu_ratio The amount of total CPU time consumed spent JIT'ing
# TYPE dotnet_jit_cpu_ratio gauge
dotnet_jit_cpu_ratio 0.5728901224489797
# HELP process_cpu_count The number of processor cores available to this process.
# TYPE process_cpu_count gauge
process_cpu_count 8
# HELP dotnet_build_info Build information about prometheus-net.DotNetRuntime and the environment
# TYPE dotnet_build_info gauge
dotnet_build_info{version="3.3.1.0",target_framework=".NETCoreApp,Version=v5.0",runtime_version=".NET Core 5.0.0-preview.2.20160.6",os_version="Microsoft Windows 10.0.18363",process_architecture="X64"} 1
# HELP dotnet_jit_method_total Total number of methods compiled by the JIT compiler
# TYPE dotnet_jit_method_total counter
dotnet_jit_method_total{dynamic="false"} 830
dotnet_jit_method_total{dynamic="true"} 30
# HELP dotnet_gc_cpu_ratio The percentage of process CPU time spent running garbage collections
# TYPE dotnet_gc_cpu_ratio gauge
dotnet_gc_cpu_ratio 0
# HELP dotnet_threadpool_scheduled_total The total number of items the thread pool has been instructed to execute
# TYPE dotnet_threadpool_scheduled_total counter
dotnet_threadpool_scheduled_total 16
# HELP dotnet_gc_allocated_bytes_total The total number of bytes allocated on the small and large object heaps (updated every 100KB of allocations)
# TYPE dotnet_gc_allocated_bytes_total counter
dotnet_gc_allocated_bytes_total{gc_heap="soh"} 3008088
dotnet_gc_allocated_bytes_total{gc_heap="loh"} 805392
# HELP dotnet_contention_total The number of locks contended
# TYPE dotnet_contention_total counter
dotnet_contention_total 0
可以看到非常多的信息啦,但是我们有时候不需要这么多指标也可以自定义。
public static void Main(string[] args)
{
    DotNetRuntimeStatsBuilder
        .Customize()
        .WithContentionStats()
        .WithJitStats()
        .WithThreadPoolSchedulingStats()
        .WithThreadPoolStats()
        .WithGcStats()
        .StartCollecting();
    CreateHostBuilder(args).Build().Run();
}
JIT,GC和线程的监控是会影响到一点点性能,我们可以通过sampleRate这个枚举的值来控制采样频率
public static void Main(string[] args)
{
    DotNetRuntimeStatsBuilder
        .Customize()
        //每5个事件个采集一个
        .WithContentionStats(sampleRate: SampleEvery.FiveEvents)
        //每10事件采集一个
        .WithJitStats(sampleRate: SampleEvery.TenEvents)
        //每100事件采集一个
        .WithThreadPoolSchedulingStats(sampleRate: SampleEvery.HundredEvents)
        .WithThreadPoolStats()
        .WithGcStats()
        .StartCollecting();
    CreateHostBuilder(args).Build().Run();
}
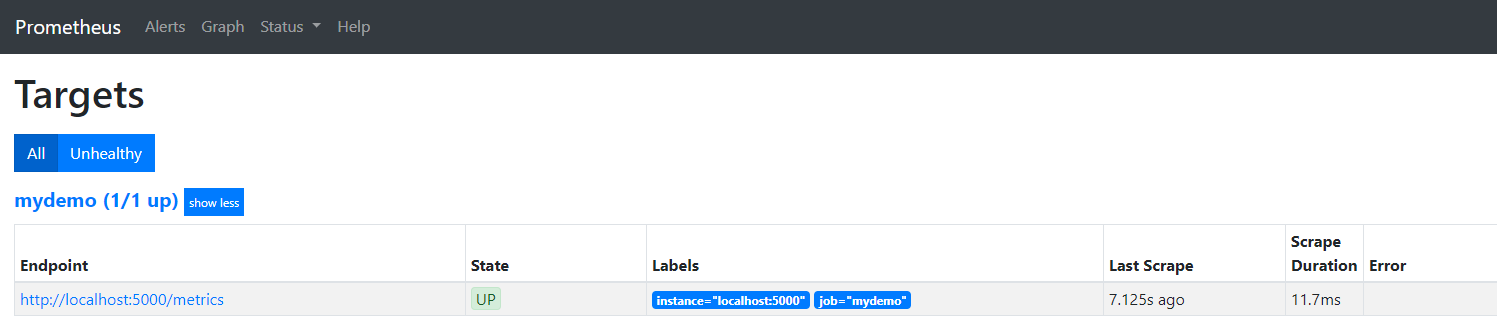
有了这些指标我们需要Prometheus来收集我们Api的指标,只需要修改prometheus.yml文件然后重启Prometheus就可以了。
scrape_configs:
- job_name: mydemo
  scrape_interval: 15s
  scrape_timeout: 10s
  metrics_path: /metrics
  scheme: http
  static_configs:
  - targets:
    - localhost:5000
启动Api项目和Prometheus,选中dotnet_collection_count_total点击Excute可以看到Api的指标是正常上报的。
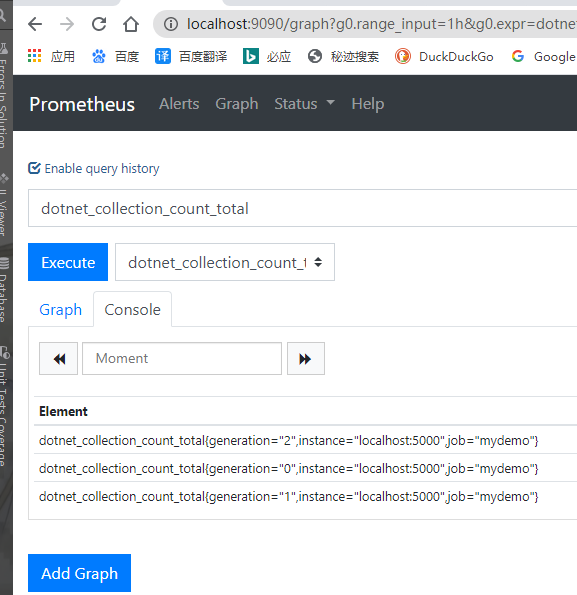
Prometheus有了数据我们就需要一个炫酷的UI去展示上报的数据啦。
Grafana
Prometheus有了数据就差一个漂亮的UI来展示的我们的指标了。Grafana是一个Go编写的开源应用,用于把指标数据可视化。是当下流行的时序数据展示工具。先下载,直接下载exe安装,完成后能打开http://localhost:3000/页面就安装成功了
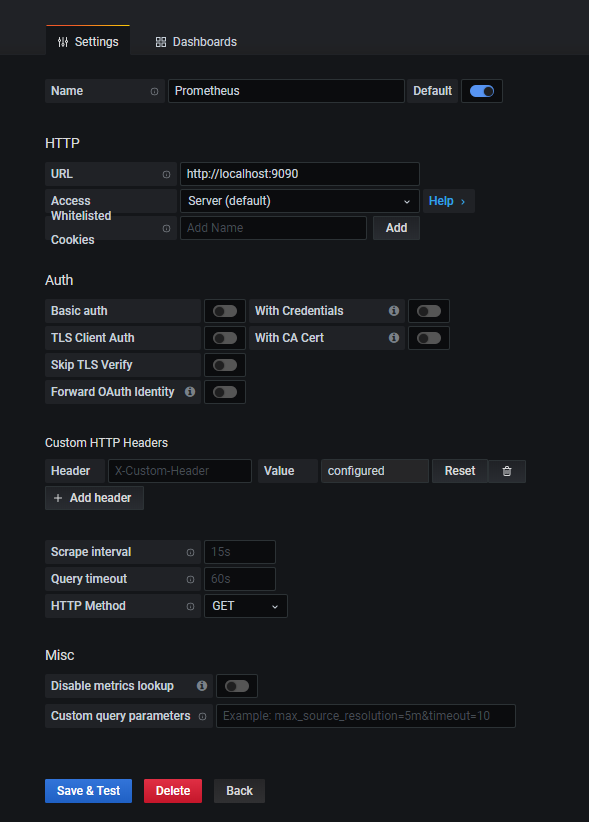
先添加数据源,选择Prometheus为数据源,并配置。
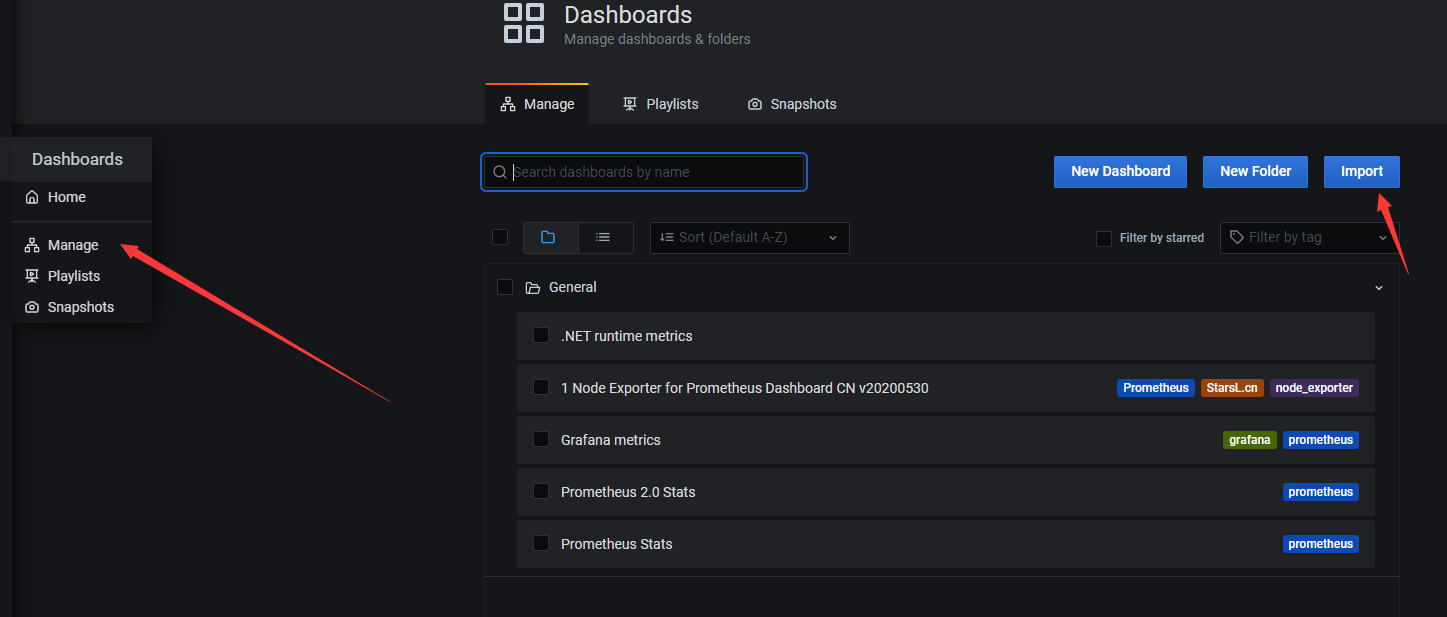
添加仪表盘
在Import via panel json中加入下面这个json,点击load,
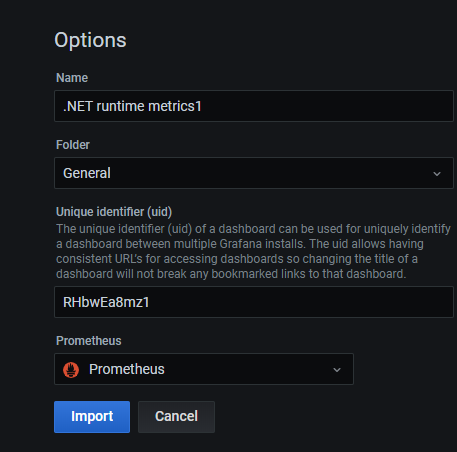
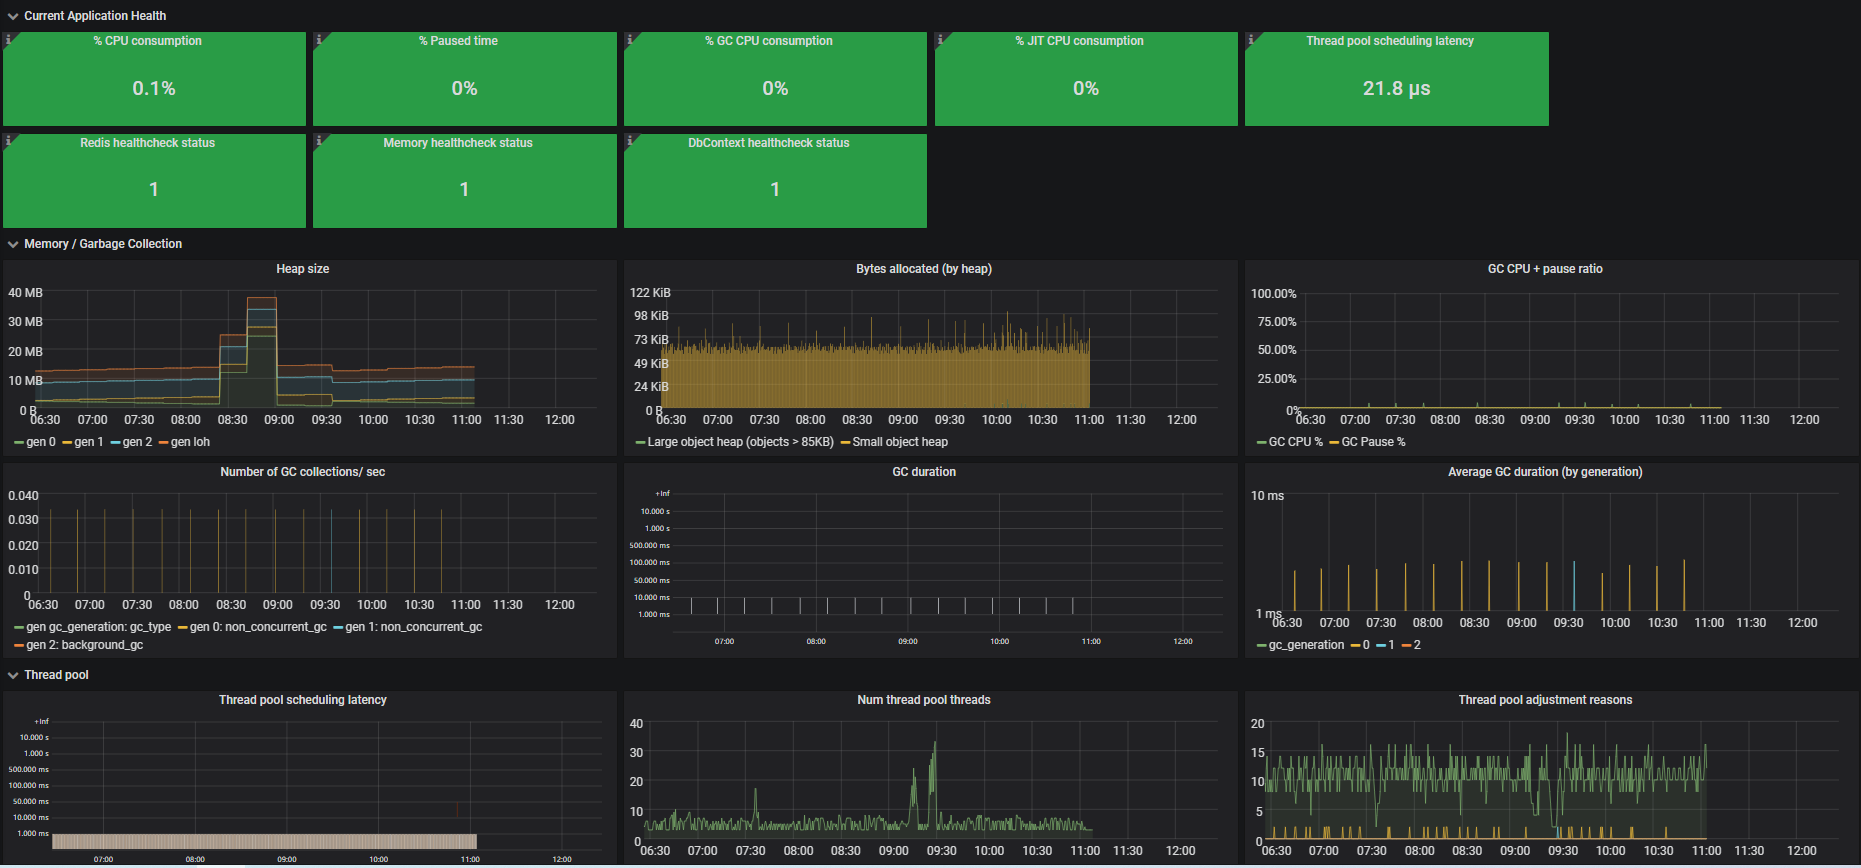
选择数据源,点击Import就能看到仪表盘了
还可以去这里添加很多现有的仪表盘。复制ID添加仪表盘。

