
Exception Helper – Rethrown Exceptions
Ever had a bug in an async method that caused an exception? Been frustrated that the debugger doesn’t show you where that exception happened? Or been frustrated when looking at an exception that has an inner exception, but the debugger doesn’t easily show you where that exception was from? Starting from the Visual Studio 2019 16.5 release, the exception helper now contains the original call stack for a rethrown exception. This helps you get to the root cause in your code of any rethrown exceptions. This is especially helpful in the case of async exceptions, which are caught and then re-thrown by framework code.
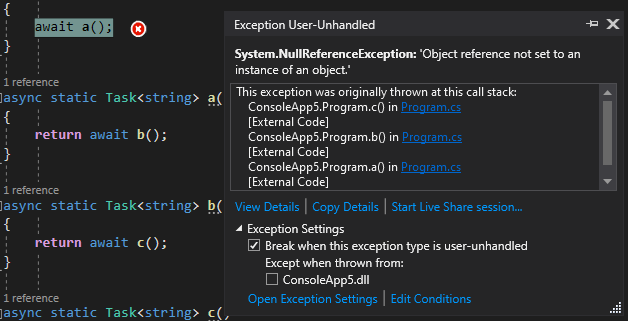
The screenshot above is taken from a simple program that’s using the ‘await’ pattern with break on thrown exceptions turned off.
static async Task Main(string[] args)
{
await a();
}
async static Task<string> a()
{
return await b();
}
async static Task<string> b()
{
return await c();
}
async static Task<string> c()
{
string s = null;
return await Task<string>.FromResult(s.ToLower());
}
In the example the exception is thrown at s.ToLower() and exception becomes unhandled at await a() and because of how await works in C# that is where the debugger stops. Unfortunately, all the useful information is back in the function c. Now with the changes in Visual Studio 2019 16.5 you can see the call stack from where the exception was originally thrown in the exception helper (screenshot below).
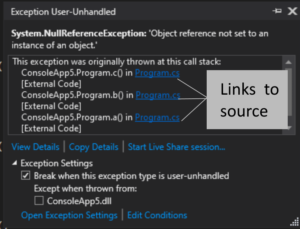
You can click on each of the Program.cs links and navigate to the source location at the top of the call stack, inside ConsoleApp5.Program.c() in this case, and then set a breakpoint to be hit next time you run the scenario. Then when the breakpoint is hit you will be stopped at the location where the exception originated and where you probably want to debug further and potentially make changes to fix the issue.
While you can navigate to the right source code with this feature, you can’t use watches to inspect the state of the application exactly as it was when the exception was initially thrown. This is simply because other code has run since then, which could have changed the state of the application. However, if you are using Visual Studio Enterprise using Visual Studio 2019 Enterprise there is another option, IntelliTrace.
IntelliTrace
With IntelliTrace VS will capture state from your application at certain points, including when exceptions are thrown, and you can go back and inspect that previous state. The easiest way to do this is to look at the Events tab of the diagnostic tools window (it pops up on the right when you F5). In the events tab you’ll see an event for each exception. In this async example each one of the async methods has a corresponding thrown and caught exception event. If you click on any of them IntelliTrace will take the debugger back to that point in time and you can use the watch windows to inspect the state as it was.
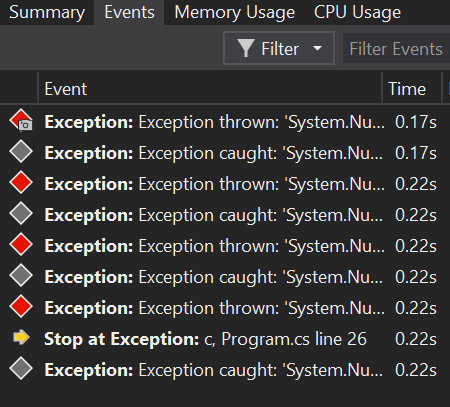
With most exceptions you probably want to go to the first instance as that’s where it was first thrown. It’s worth mentioning that not all the state is captured for every exception. Things such as the locals and parameters are, but if you were to enter new expression in the watch window it might not evaluate. If you want to capture all the state of the application, you should enable the IntelliTrace Snapshots feature. You can do that by going to Tools Options -> IntelliTrace and enabling “IntelliTrace snapshots (managed and native)” as shown below.
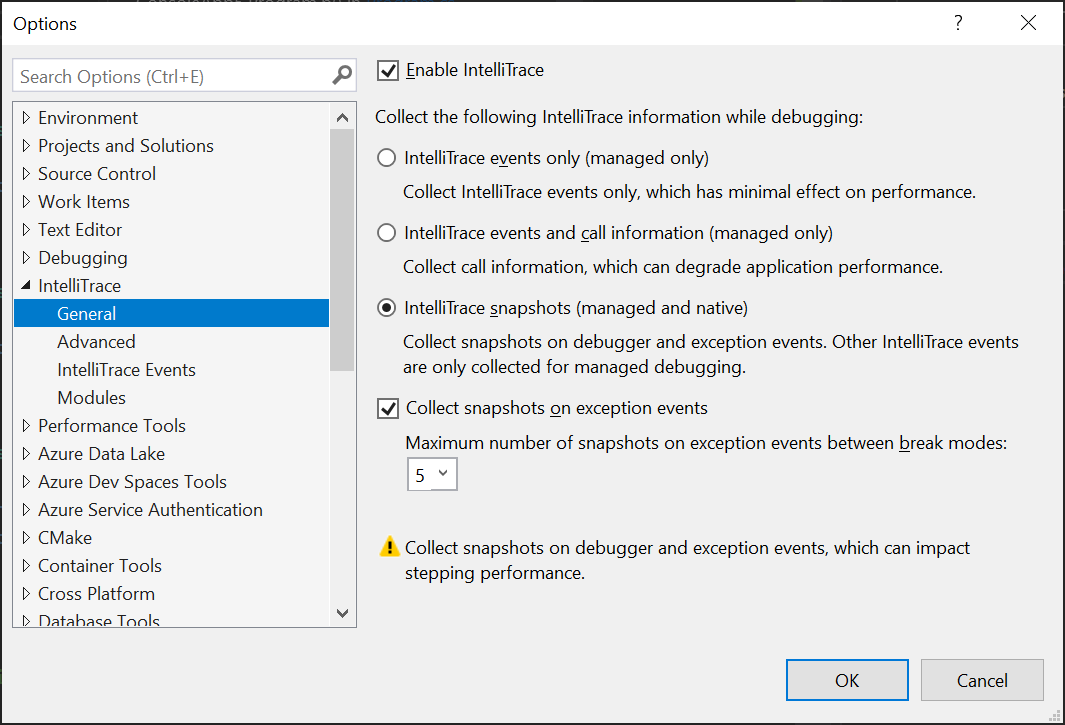
With IntelliTrace Snapshots the entire state of the application is captured, and you can inspect anything in the application via the locals and watch windows.
There are more details in our docs at https://docs.microsoft.com/en-us/visualstudio/debugger/view-historical-application-state?view=vs-2019.
Conclusion
Debugging async code is challenging and something that we are committed to improving the experience of in Visual Studio. This feature is a small step on a path to improving that experience. We have more in mind for the future and would love your feedback, and to hear about the challenges you face and how features like this and others may help or not. If you’re interested in taking part in customer research feel out the survey at https://www.research.net/r/3WNNWV8. You can also reach out to me on twitter at @andysterland.
Last, but not least, please suggest and vote on features over on Developer Community at https://developercommunity.visualstudio.com/content/idea/post.html?space=8.
Look forward to hearing your feedback!
 Light
Light Dark
Dark
3 comments
Is it available in version 16.5? I have Microsoft Visual Studio Professional 2019 Version 16.5.4 and I can’t find neither the original call stack in exception helper, nor the IntelliTrace tool.
IntelliTrace is available in Visual Studio Enterprise edition, but not in the Visual Studio Professional or Community editions. See: https://docs.microsoft.com/en-us/visualstudio/debugger/intellitrace-features?view=vs-2019
Nice addition, thanks!
Still, would be really great if VS would break where the original exception is thrown (in this case – method `c()`), not where it is awaited.
I understand that technically exception is handled, but that’s doesn’t make life easier.