
.NET Core微服务之基于App.Metrics+InfluxDB+Grafana实现统一性能监控
Tip: 此篇已加入.NET Core微服务基础系列文章索引
一、关于App.Metrics+InfluxDB+Grafana
1.1 App.Metrics

App.Metrics是一款开源的支持.NET Core的监控插件,它还可以支持跑在.NET Framework上的应用程序(版本 >= 4.5.2)。官方文档地址:https://www.app-metrics.io/
1.2 InfluxDB

InfluxDB是一款开源的分布式时序、时间和指标数据库,使用go语言编写,无需外部依赖。官网地址:https://portal.influxdata.com
1.3 Grafana

Grafana是一个可视化面板(Dashboard),有着非常漂亮的图表和布局展示,功能齐全的度量仪表盘和图形编辑器,支持Graphite、zabbix、InfluxDB、Prometheus和OpenTSDB作为数据源。官网地址:https://grafana.com/
二、InfluxDB的安装与配置
2.1 Linux下的安装
请参考focus-lei的文章《.NET Core使用App.Metrics + InfluxDB + Grafana进行APM监控》,我这里只是做demo,所以选择了在我的Windows Server虚拟机中安装,快速一点。当然,你可以通过docker拉取influxdb的镜像创建一个容器,这样更快。
# docker pull tutm/influxdb
2.2 Windows下的安装
(1)下载Windows版本(64位),下载地址:https://dl.influxdata.com/influxdb/releases/influxdb-1.5.2_windows_amd64.zip
(2)解压之后放到你想要放置的位置,然后编辑influxdb.conf配置文件:(因为其默认配置是针对Linux的)
[meta]
# Where the metadata/raft database is stored
dir = "C:/APM/influxdb/meta"
[data]
# The directory where the TSM storage engine stores TSM files.
dir = "C:/APM/influxdb/data"# The directory where the TSM storage engine stores WAL files.
wal-dir = "C:/APM/influxdb/wal"
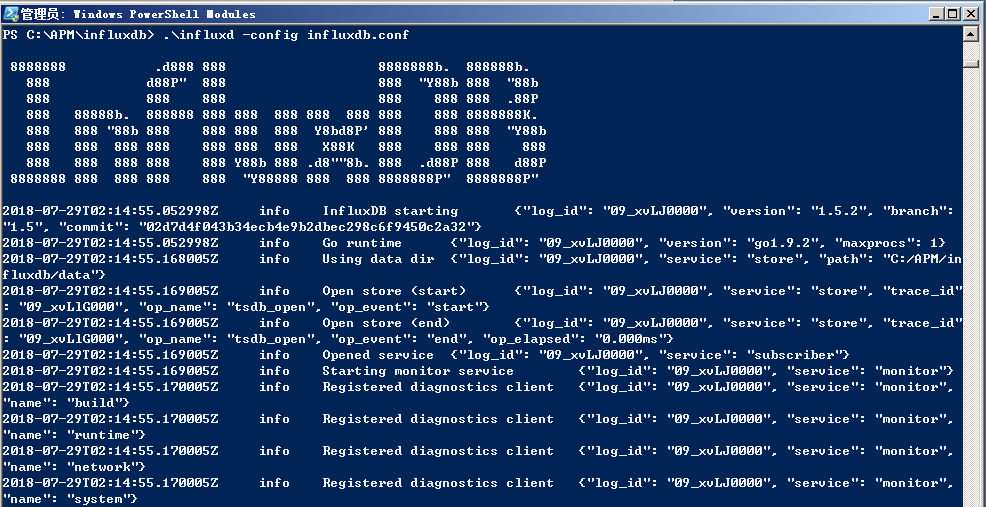
(3)进入cmd,以命令模式运行influxd:
cmd >> .\influxd -config influxdb.conf
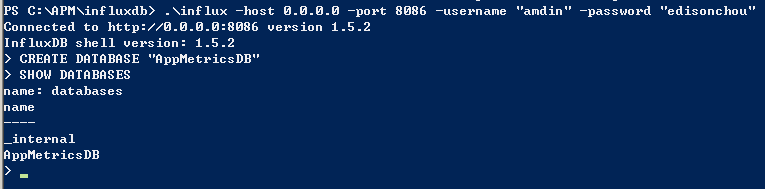
(4)然后新开一个cmd,连上influxdb,然后创建一个database
cmd >> .\influx -host 127.0.0.1 -port 8086 -username "admin" -password "edisonchou"
关于influxdb的更多命令,可以浏览参考资料关于influxdb的InfluxDB入门教程。
三、Grafana的安装与配置
2.1 Linux下的安装
同1.1部分,不再赘述。
2.2 Windows下的安装
(1)下载Windows版本(64位),下载地址:https://s3-us-west-2.amazonaws.com/grafana-releases/release/grafana-5.2.2.windows-amd64.zip
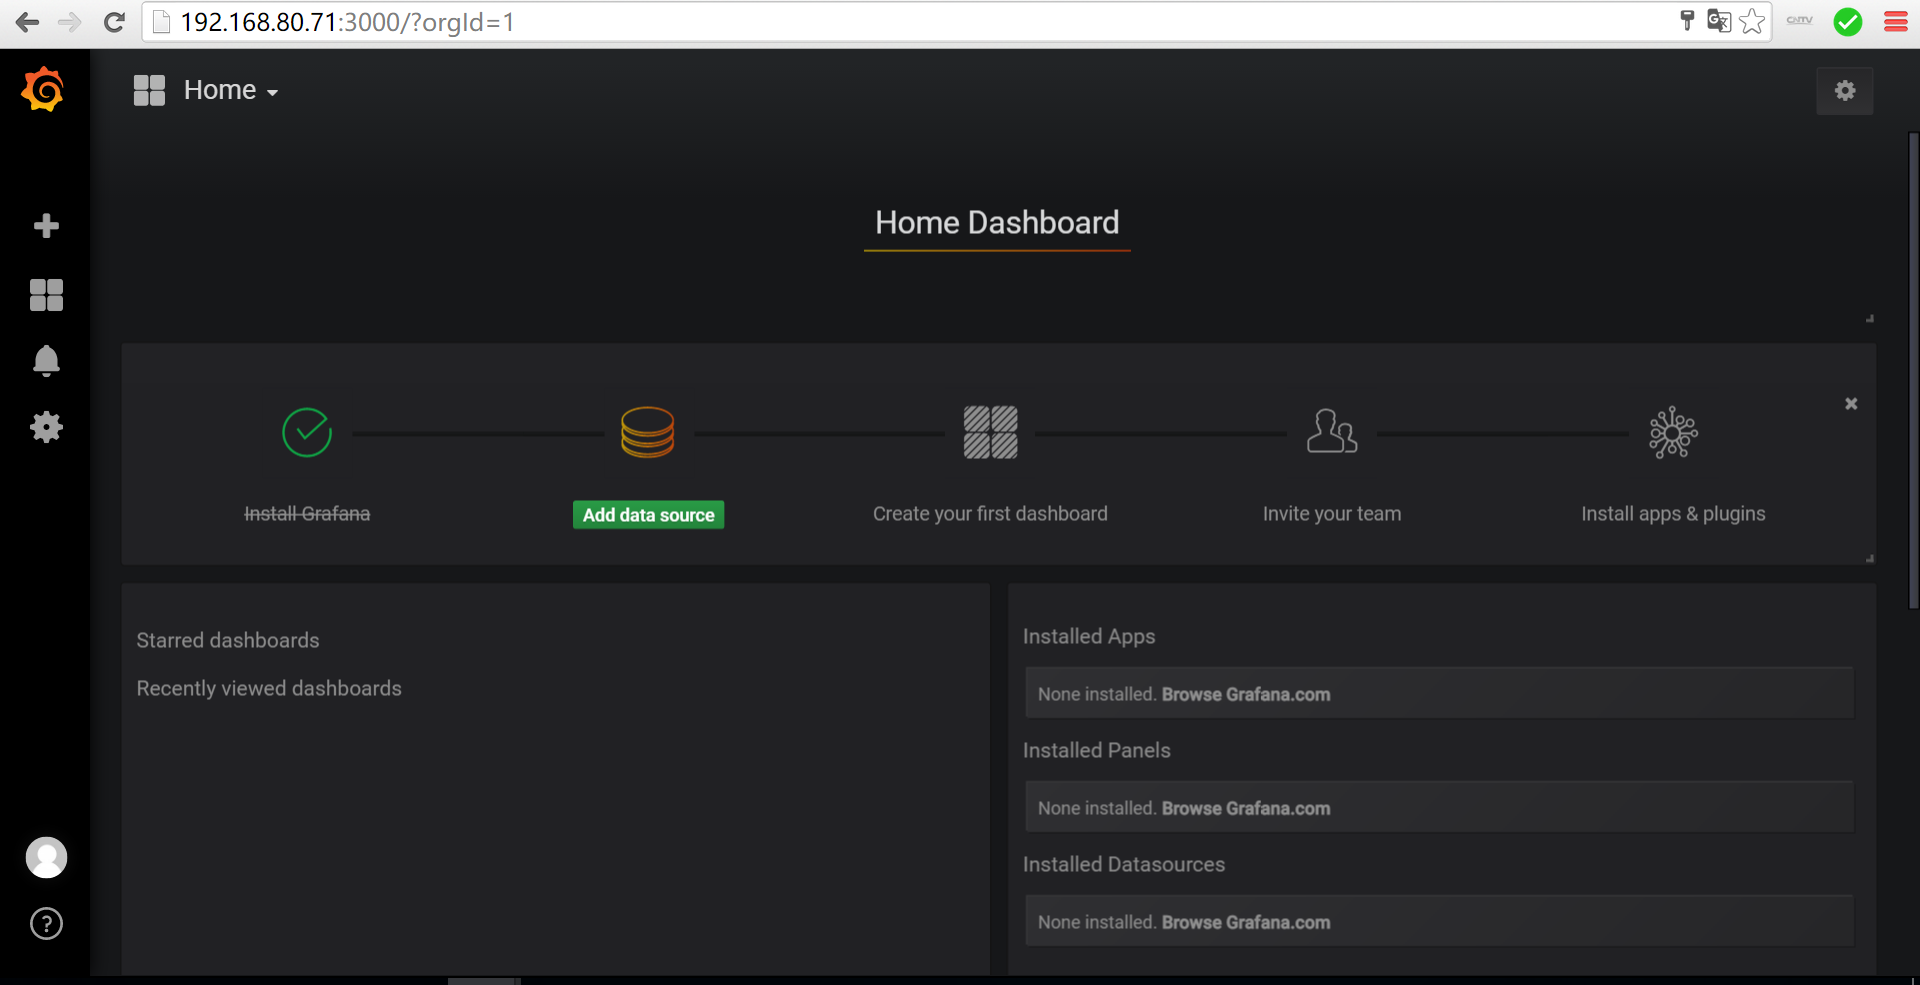
(2)直接运行grafana-server.exe即可,默认绑定3000端口号。
(3)浏览器打开serverip:3000,使用默认账号admin/admin(账号密码都是admin)登录,主界面如下图所示:
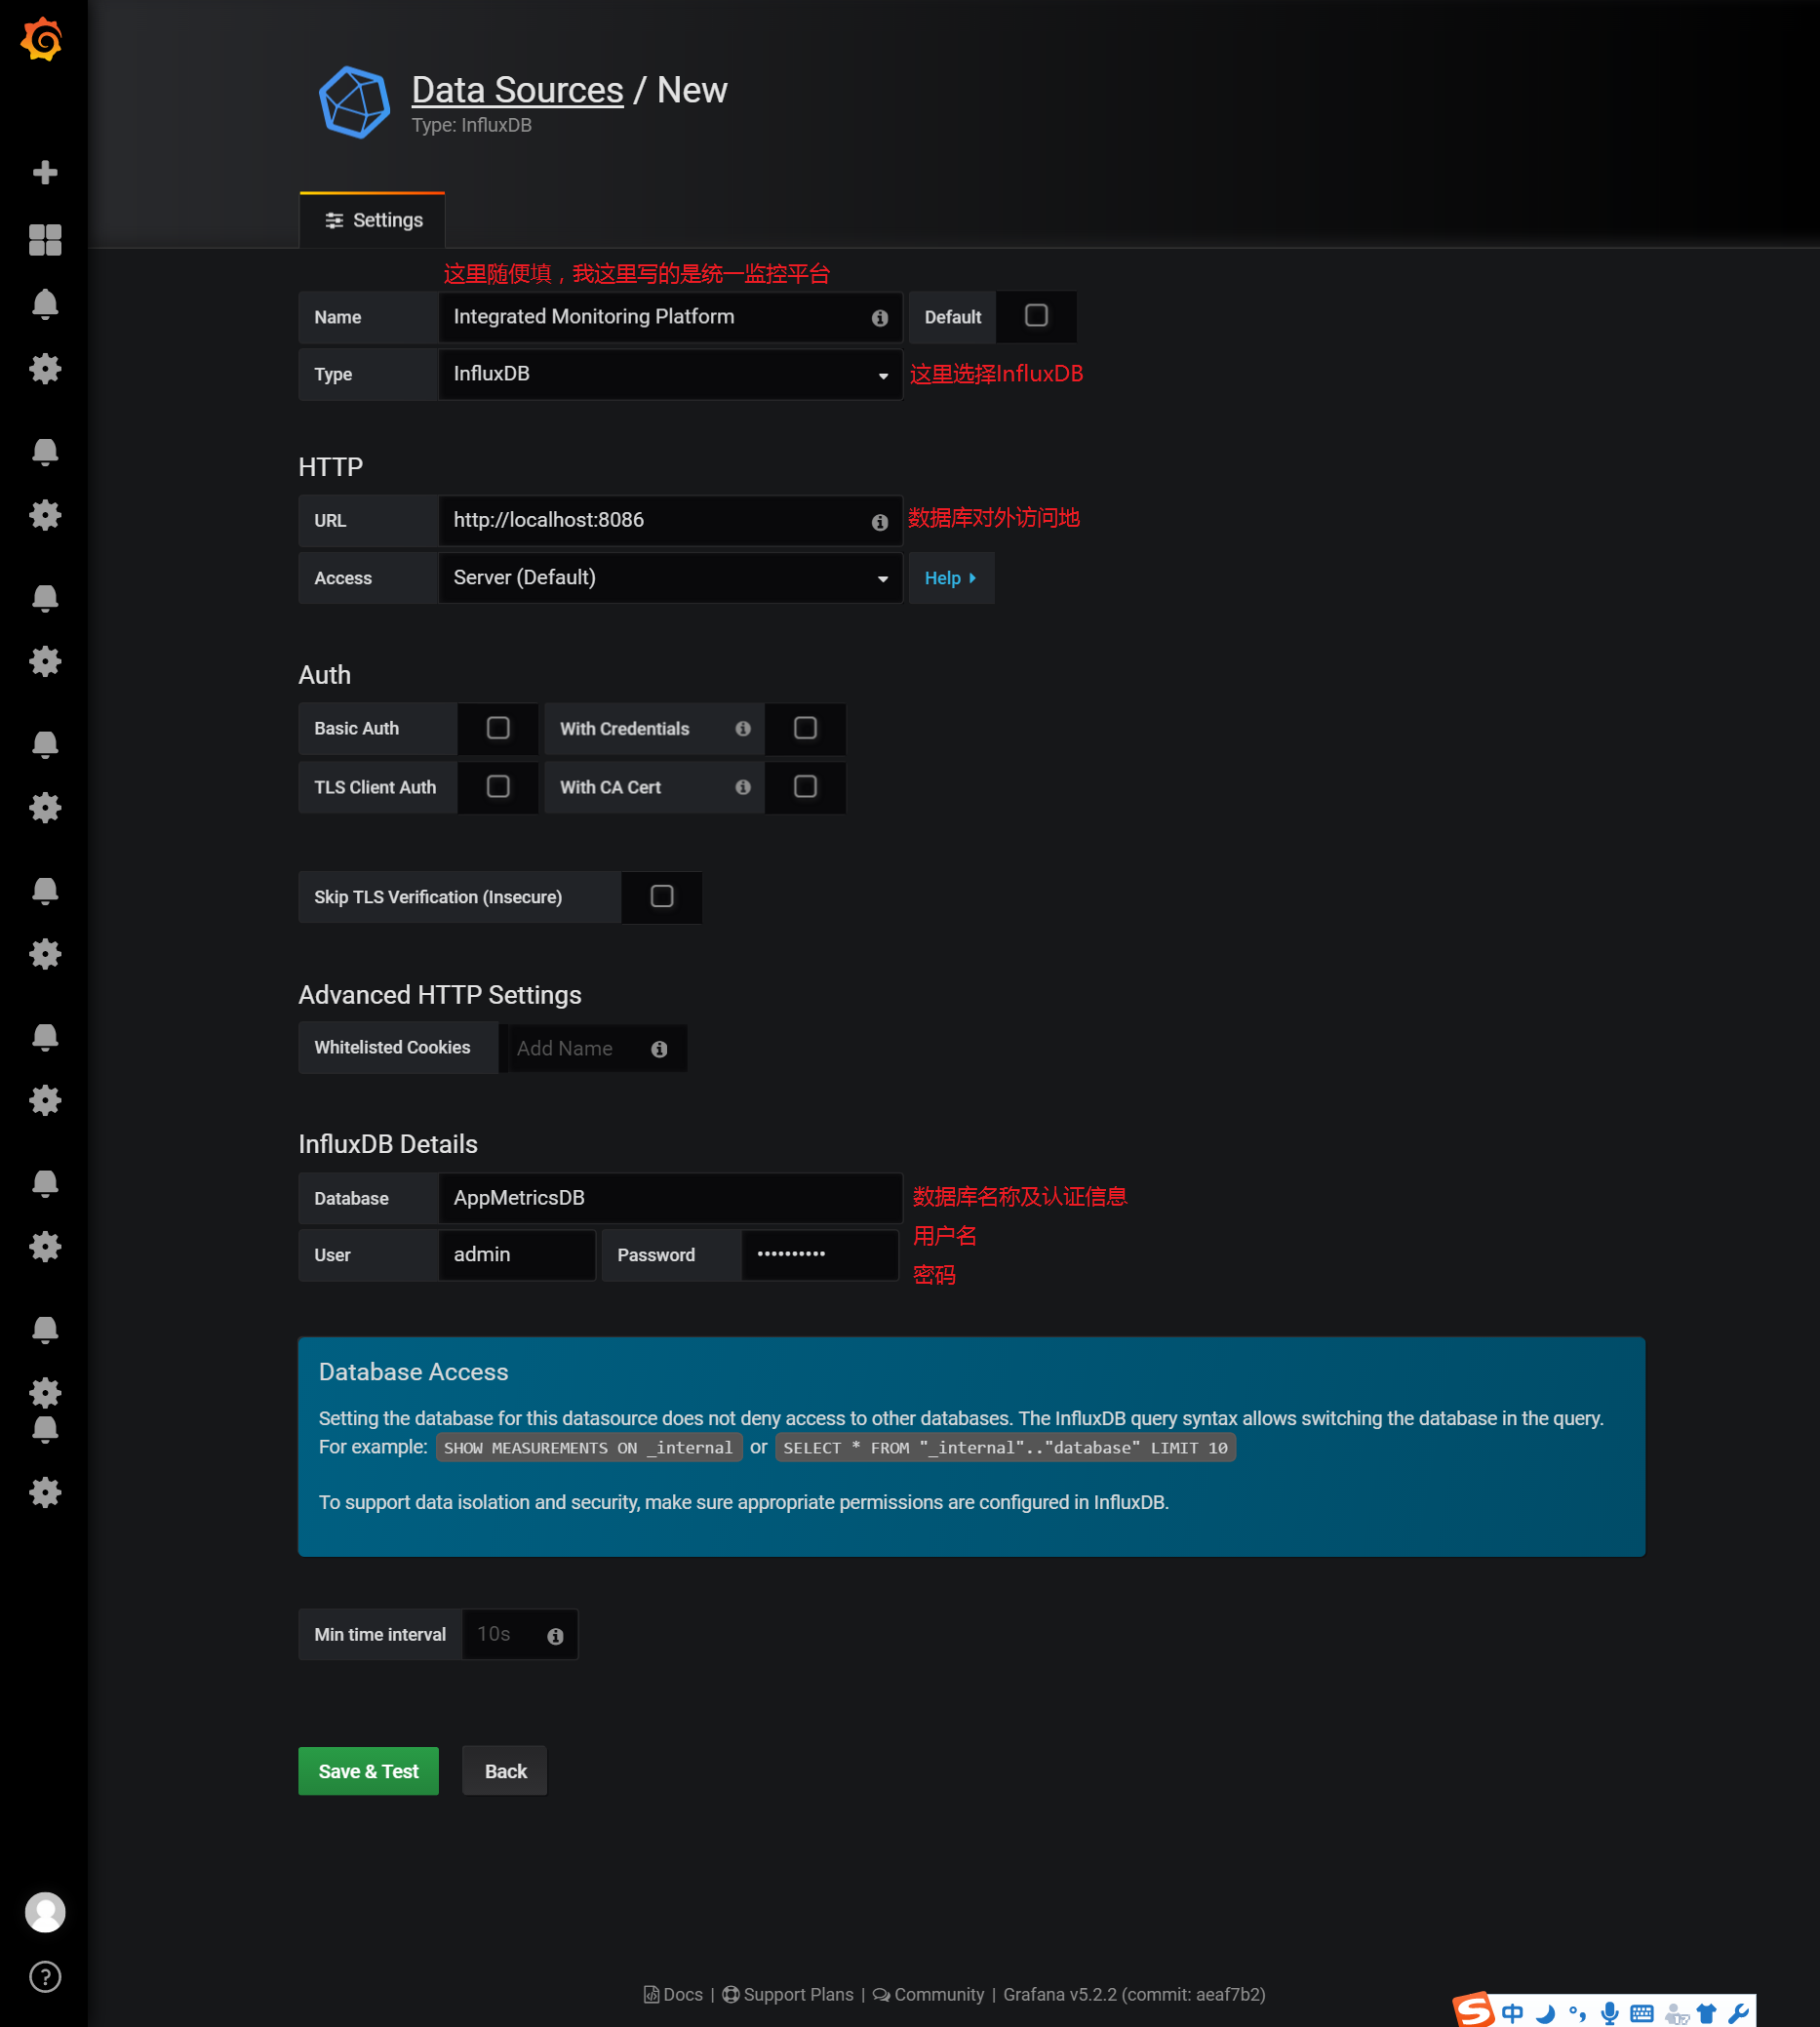
(4)为InfluxDB添加数据源
在Configuration中点击Add data source按钮,进入如下图所示的添加界面,输入你安装的InfluxDB数据库信息
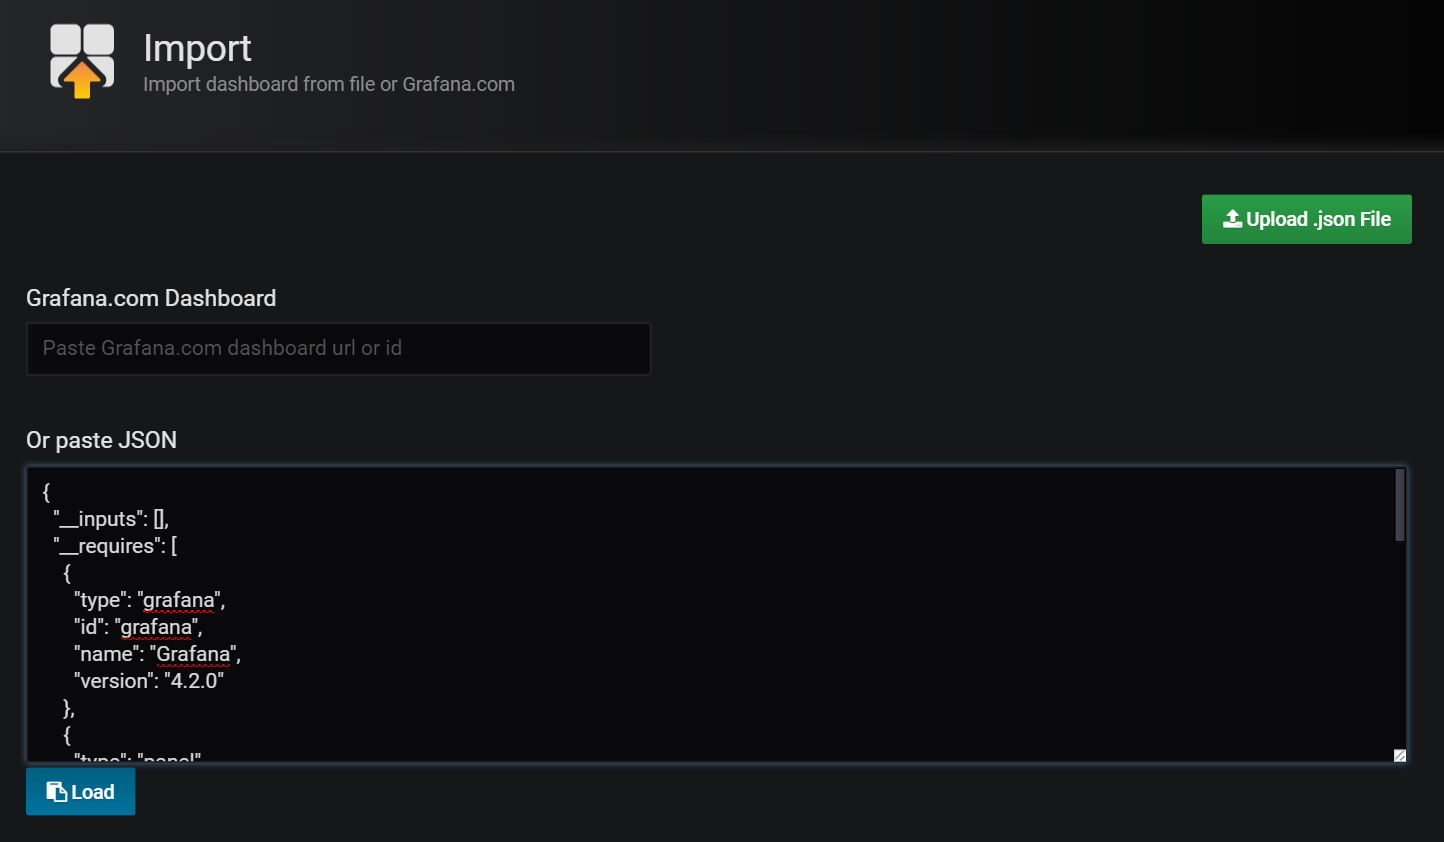
(5)为Grafana添加InfluxDB的Dashboard仪表盘的JSON文件
这里有两种方式:一种是直接给URL=>https://grafana.com/dashboards/2125,另一种是我们手动下载这个URL的JSON,然后把JSON粘贴过来。
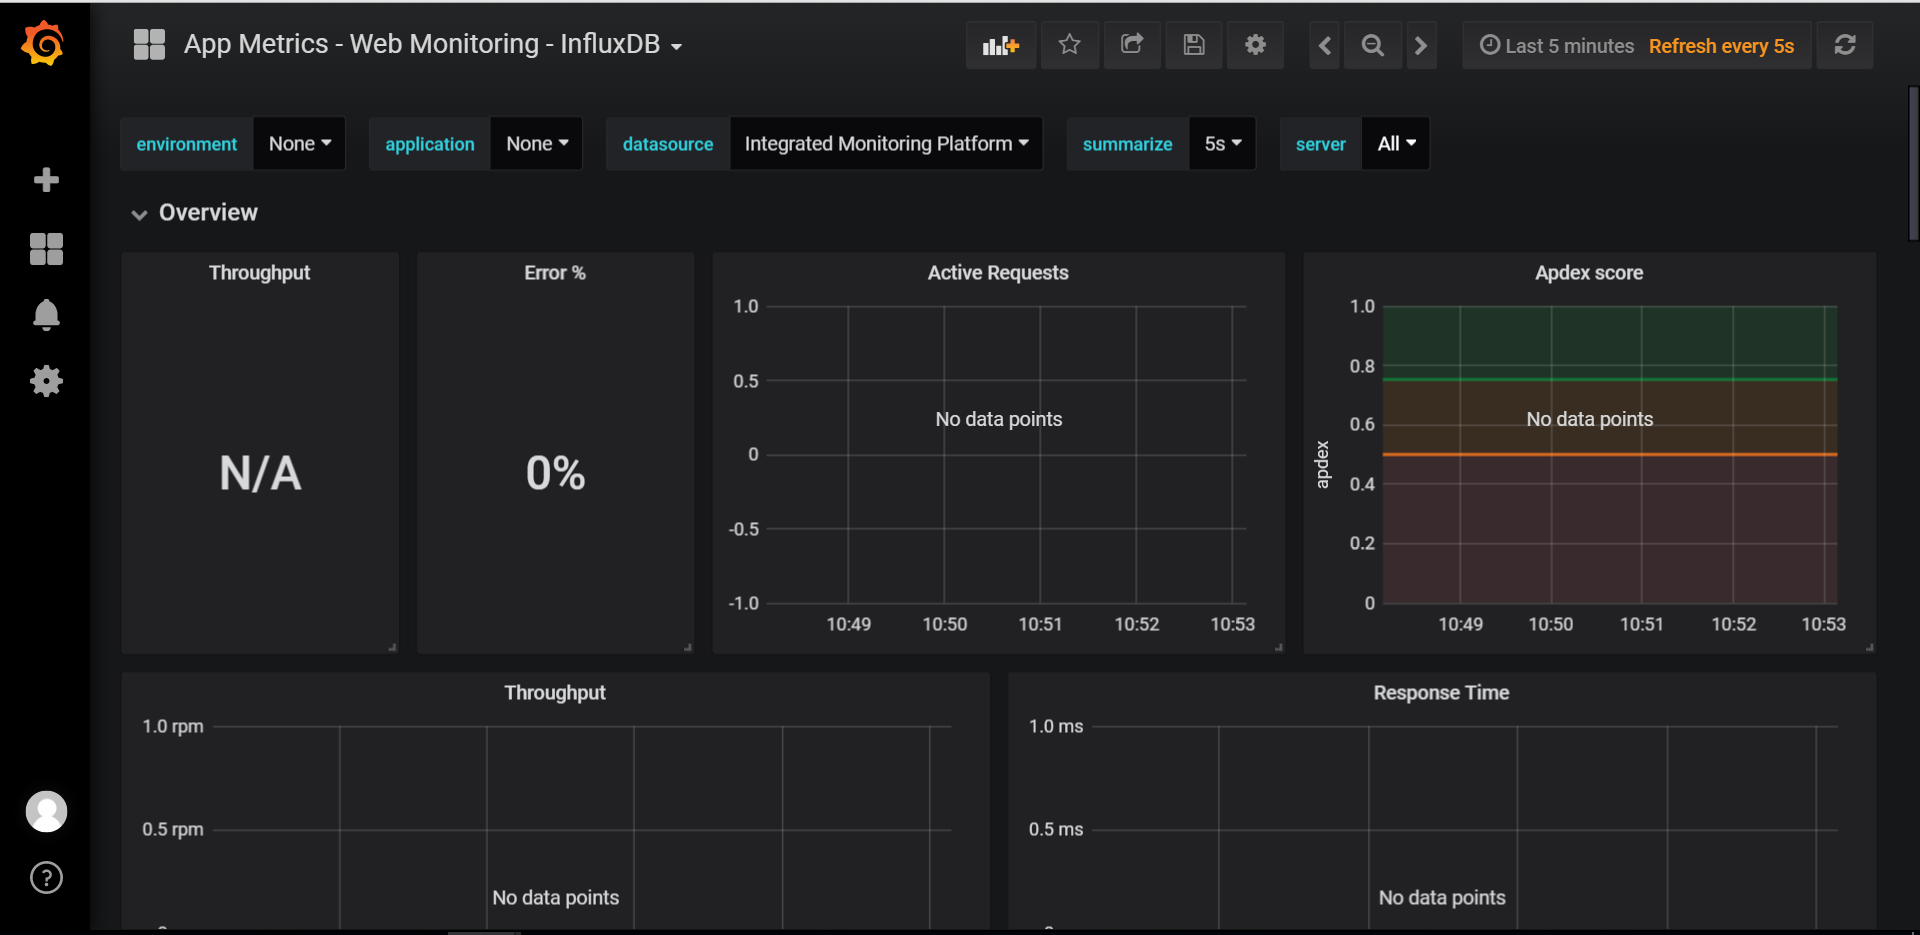
(6)导入之后,查看这个Dashboard:
四、App.Metrics的使用与API网关集成
注意:以下的配置和代码都只是在API网关(Ocelot)中做的,至于具体API服务中不需要做配置。
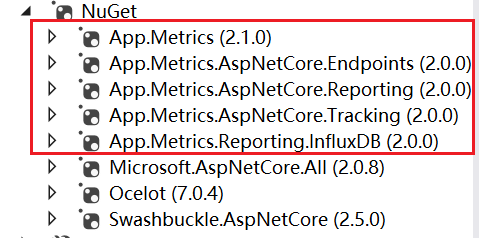
4.1 安装App.Metrics
通过NuGet安装以下几个package:
4.2 集成API网关
(1)添加配置文件关于InfluxDB的部分
"AppMetrics": {
    "IsOpen": true,
    "DatabaseName": "AppMetricsDB",
    "ConnectionString": "http://192.168.80.71:8086",
    "UserName": "admin",
    "Password": "edisonchou",
    "App": "MSAD",
    "Env": "Development"
  }
(2)修改StartUp类,注入AppMetrics并设置
    public void ConfigureServices(IServiceCollection services)
    {
       ......

        // AppMetrics
        bool isOpenMetrics = Convert.ToBoolean(Configuration["AppMetrics:IsOpen"]);
        if (isOpenMetrics)
        {
            string database = Configuration["AppMetrics:DatabaseName"];
            string connStr = Configuration["AppMetrics:ConnectionString"];
            string app = Configuration["AppMetrics:App"];
            string env = Configuration["AppMetrics:Env"];
            string username = Configuration["AppMetrics:UserName"];
            string password = Configuration["AppMetrics:Password"];

            var uri = new Uri(connStr);
            var metrics = AppMetrics.CreateDefaultBuilder().Configuration.Configure(options =>
            {
                options.AddAppTag(app);
                options.AddEnvTag(env);
            }).Report.ToInfluxDb(options =>
            {
                options.InfluxDb.BaseUri = uri;
                options.InfluxDb.Database = database;
                options.InfluxDb.UserName = username;
                options.InfluxDb.Password = password;
                options.HttpPolicy.BackoffPeriod = TimeSpan.FromSeconds(30);
                options.HttpPolicy.FailuresBeforeBackoff = 5;
                options.HttpPolicy.Timeout = TimeSpan.FromSeconds(10);
                options.FlushInterval = TimeSpan.FromSeconds(5);
            }).Build();

            services.AddMetrics(metrics);
            services.AddMetricsReportScheduler();
            services.AddMetricsTrackingMiddleware();
            services.AddMetricsEndpoints();
        }
    }

    // This method gets called by the runtime. Use this method to configure the HTTP request pipeline.
    public void Configure(IApplicationBuilder app, IHostingEnvironment env)
    {
        ......

        // AppMetrics
        bool isOpenMetrics = Convert.ToBoolean(Configuration["AppMetrics:IsOpen"]);
        if (isOpenMetrics)
        {
            app.UseMetricsAllEndpoints();
            app.UseMetricsAllMiddleware();
        }

        // Ocelot
        app.UseOcelot().Wait();
    }
五、运行效果展示
这时我们把API网关、ClientService和ProductService同时启动起来,然后通过浏览器不停的请求这两个服务的某个API接口。
请求一段时间后,我们进入Grafana的Dashboard来查看:
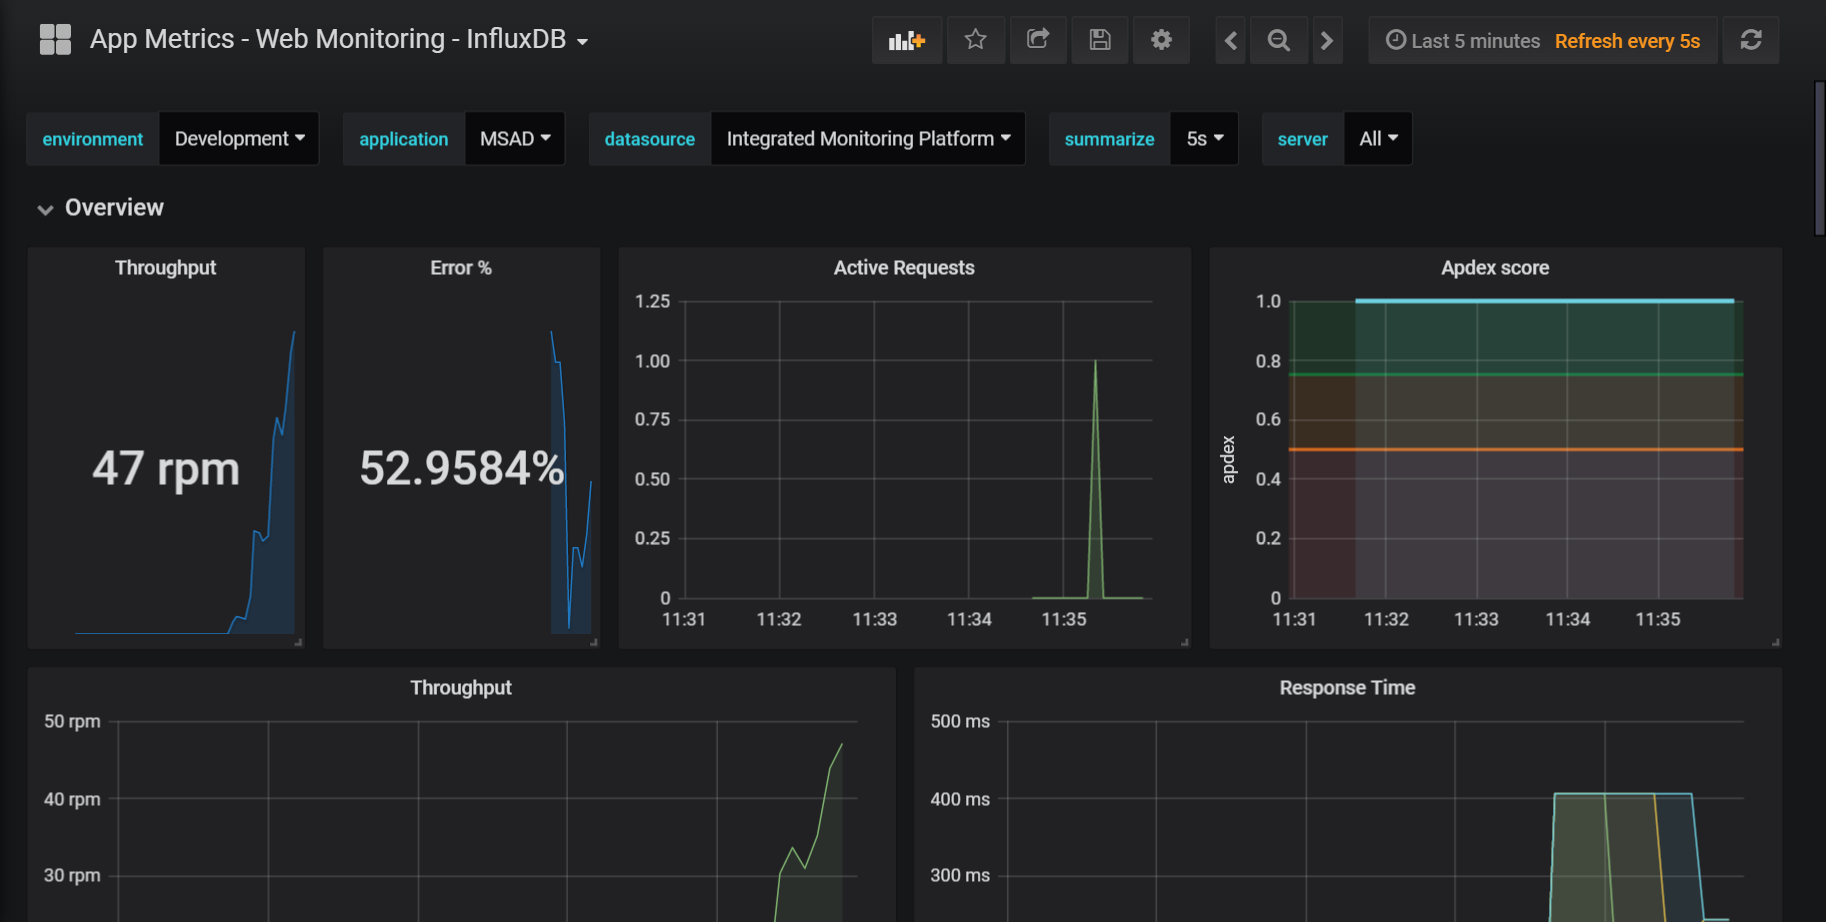
可以看到,原本空荡荡的仪表盘已经满血复活,各种曲线和数据出来了。这里Error有数据是因为我的程序中有bug,出现了异常。
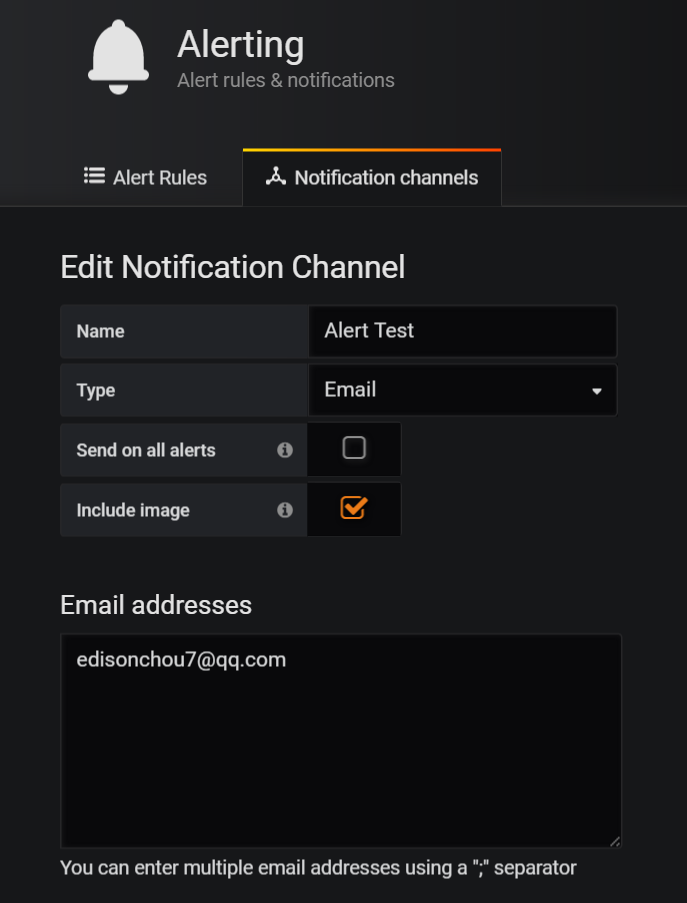
我们也也可以设置Grafana的Alerting设置,让其可以为我们发送告警邮件(可以选择Include Image),当然你事先得改一下Grafana的配置文件,贴上你的SMTP服务器和账号密码信息。
六、小结
本篇首先简单介绍了一下App.Metrics、InfluxDB与Grafana,然后介绍了如何安装和配置这套开源监控组合,最后通过与API网关Ocelot的集成,让我们的ASP.NET Core程序可以跑在监控平台之下,并可以通过Grafana的Dashboard实时查看性能数据。当然,本篇只是一个简单的Quick Start,很多细节没有深究,有兴趣的园友可以通过参考资料去仔细研究。
参考资料
(1)顾镇印,《ASP.NET Core之跨平台的实时监控》
(2)老衲平僧,《InfluxDB+Grafana+AppMetrics监控系统》
(3)landon,《.NET Core 2.0+InfluxDB+Grafana+AppMetrics实现跨平台的实时性能监控》
(4)focus-lei,《.net core使用App.Metrics+InfluxDB+Grafana进行APM监控》
(5)桂素伟,《Ocelot监控》
(6)仰望星空脚踏实地,《InfluxDB入门教程》
(7)JackyRoc,《InfluxDB使用说明》
(8)InfluxDB官方文档:http://docs.influxdata.com/influxdb/v1.6/


